Data from CoinMarketCap & Alternative.me as of Jan 22, 2026. Verify before trading.
Something interesting is happening with Chainlink. While the broader market sits in "Extreme Fear" territory and most altcoins struggle for direction, LINK has quietly become the center of institutional attention. Two competing ETFs are now live on Wall Street. CME is launching futures in three weeks. And whales are accumulating at a pace we haven't seen in months.
Freya flagged LINK repeatedly this week. The data shows the top 100 whales resuming accumulation below $13, exchange reserves dropping significantly, and what appears to be the first higher low formation since the bear market began. The technical setup is aligning with the fundamental narrative.
This article breaks down what we're seeing: the ETF landscape, the CME futures catalyst, the whale activity Freya detected, and the key price levels you need to watch. We also cover the risks, because this setup is not without its challenges.
Who this is for: Traders looking for data-driven altcoin opportunities backed by institutional flows. We present the facts. You make the decisions.
Chainlink is the industry-standard oracle network that connects smart contracts with real-world data. Think of it as the bridge between blockchains and everything else: price feeds, weather data, sports scores, bank account balances, and more. Without oracles, smart contracts would be isolated systems with no way to know what's happening in the real world.
This makes Chainlink critical infrastructure for DeFi. Protocols like Aave, Compound, and Synthetix rely on Chainlink price oracles to function. More recently, major financial institutions including Swift, JP Morgan, and Mastercard have adopted Chainlink for tokenization projects, signaling its growing role in traditional finance.
Our market intelligence system flagged several interesting signals around LINK over the past week. Here is what stood out:
Freya detected the top 100 LINK whales resuming accumulation as the price dipped below $13. This is significant because it shows smart money buying into weakness rather than chasing rallies.
On-chain data confirms significant whale activity: multiple large wallets have been withdrawing LINK from exchanges to self-custody, a pattern associated with long-term accumulation. One tracked wallet accumulated over 340,000 LINK (~$4.8M) in early January. Exchange reserves have dropped notably as tokens move off exchanges.
Freya noted that LINK is forming its first higher low since the bear market. The technical structure shows higher lows above $12.80 and $13.20, reflecting improving market strength. Analysts say if this pattern holds and breaks up, new highs are plausible.
Freya also noted that LINK closed indecisively multiple times and needs LINKBTC to show strength for sustained momentum. The $14.20 level is critical: staying above it indicates bullish momentum, while falling below could extend sideways trading.
No analysis is complete without understanding what can go wrong. Here is what you need to consider:
| Risk Factor | Level | Details |
|---|---|---|
| BTC Dominance Still Elevated | HIGH | BTC dominance at 59% is capping altcoin strength. LINK needs BTC.D to decline for sustained outperformance. Freya noted this repeatedly. |
| $15 Resistance Wall | MEDIUM | There is $1.2M in liquidity sitting at $15. This is described as LINK's "make-or-break level." Failure here could trigger a retest of lower support. |
| Multiple Indecisive Closes | MEDIUM | Freya flagged LINK closing indecisively on multiple days. The token needs healthier daily candles to confirm any bullish reversal. |
| Broader Market in Extreme Fear | HIGH | Fear & Greed Index at 20 (Extreme Fear). Risk-off sentiment dominates. If BTC breaks down, LINK will likely follow regardless of its own fundamentals. |
Here is what the charts are showing:
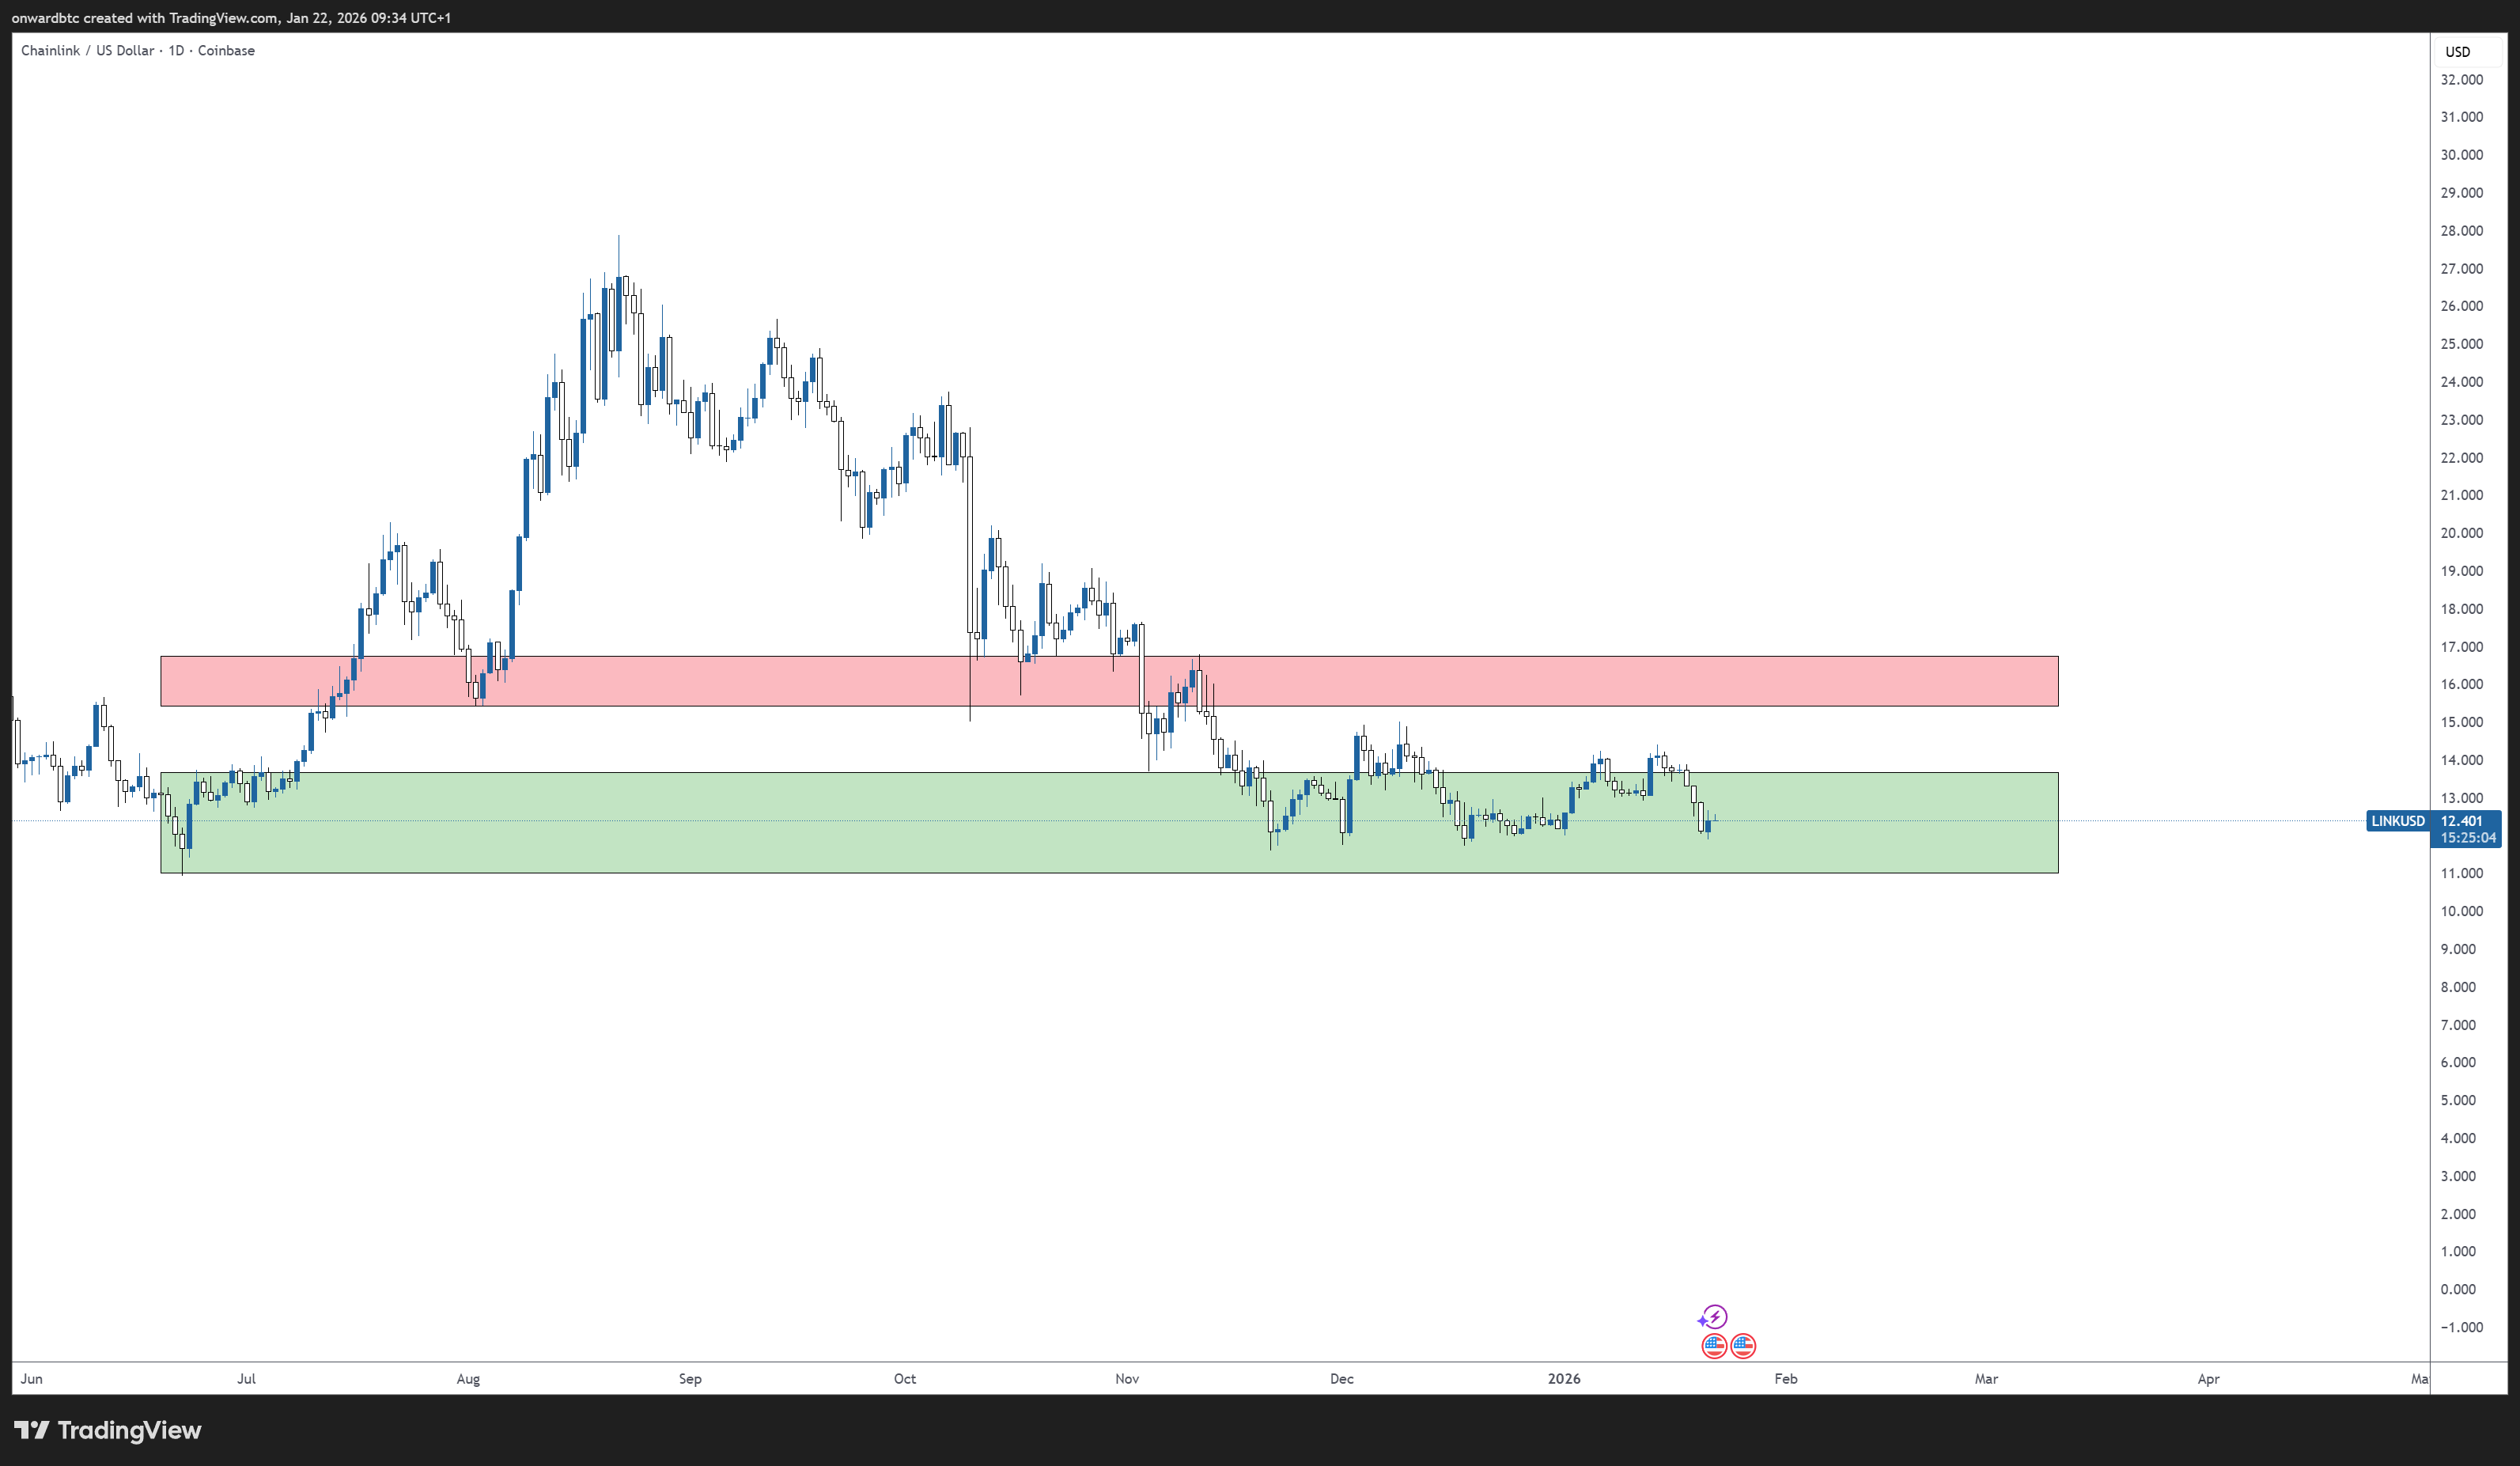
Click chart to view full size
A breakout above $15 with strong volume could trigger a measured move to $20-$25 based on the symmetrical triangle pattern. However, failure to hold $13.50 could retest the 38.2% Fibonacci level at $13.38. Confirmation is required with a strong breakout candle before taking significant positions.
CME Group plans to launch cash-settled Chainlink futures with standard (5,000 LINK) and micro (250 LINK) contracts. This gives institutional investors regulated tools for hedging and speculation, potentially reducing volatility and attracting traditional finance capital.
Grayscale's GLNK (launched December 2025) and Bitwise's CLNK (launched January 14, 2026) now hold combined assets approaching $100M. Both saw strong initial inflows. These ETFs create baseline demand and reduce friction for traditional investors seeking LINK exposure without directly holding the token.
Swift has been conducting multiple tokenization pilots, including work with UBS Asset Management and Chainlink to bridge tokenized assets with existing payment systems. Separately, Swift completed a multi-bank interoperability trial with BNP Paribas, Intesa Sanpaolo, and Societe Generale. These initiatives demonstrate growing institutional focus on blockchain infrastructure.
Chainlink's Cross-Chain Interoperability Protocol (CCIP) continues expanding with the Cross-Chain Token (CCT) standard, enabling token issuers to self-integrate assets and supporting EVM-compatible zkRollups. Partners like Aave and DTCC have piloted CCIP, potentially increasing demand for Chainlink services.
Watch the $14.20 level. A clean break and hold above it opens the path to $15.00. The $12.80 support is your invalidation level for any long thesis. Consider scaling in on pullbacks to the $13.00-$13.50 zone with stops below $12.80.
The combination of ETF inflows, CME futures, and historic low exchange reserves creates a compelling supply/demand picture for longer holds. The $15 breakout would be confirmation of trend change. Consider building positions on significant pullbacks with a 6-12 month outlook.
The $13.00 and $14.20 levels provide clear rejection points for intraday scalps. Freya noted LINK following Bitcoin's sentiment on lower timeframes. Watch BTC price action closely and respect your stops. Size down around the CME futures launch date when volatility may spike.
Grayscale's GLNK was converted from a trust in December 2025. Bitwise's CLNK launched on January 14, 2026 with a 0.34% fee (waived for three months on the first $500M). Both track the spot price of LINK and are listed on NYSE Arca, giving US investors regulated access without directly holding the token. For current AUM figures, check the respective fund pages.
CME futures (pending regulatory review for Feb 9 launch) provide regulated, cash-settled derivatives that institutions need for risk management. Historically, CME listings have preceded increased institutional adoption and improved market structure. The micro contracts (250 LINK) also make it accessible to smaller traders seeking regulated exposure.
Technical analysis shows a measured move target of $20-$25 if LINK breaks above the $15 resistance with volume. Some analysts see potential for higher based on the RWA tokenization narrative. However, failure to hold $13.50 could retest lower supports. The all-time high of $52.99 (May 2021) remains distant. No one can predict prices with certainty.
We do not give investment advice. What we can tell you: the data shows whale accumulation, two live ETFs, CME futures launching, and historic low exchange reserves. It also shows indecisive price action, elevated BTC dominance, and a market still in "Fear" territory. Make your own decision based on your risk tolerance and trading style.
Freya monitors order flow across major exchanges, tracks large wallet movements, analyzes liquidation clusters, and identifies patterns in buying and selling behavior. When significant net buying or selling occurs, or when the top 100 holders change their positions, Freya flags it in real-time so you can see what big players are doing.
Freya monitors markets 24/7 and delivers insights like these directly to your Telegram. No charts to decode. No confusion. Just professional intelligence.
Try Free for 30 DaysNo credit card required • Cancel anytime
This article is for informational purposes only and does not constitute financial advice. Cryptocurrency trading involves substantial risk of loss. Past performance does not guarantee future results. The price data, whale activity analysis, and technical levels presented are based on available information at time of publication and may change rapidly. Always do your own research and consider your financial situation before making investment decisions. Never invest more than you can afford to lose.